Data science analytics.

Data Analytics

Sonomatic has consistently been at the forefront of the development and utilisation of data analytics. This has resulted in two main benefits: maximisation of the amount of quality information we can draw from inspection data and providing clients useful high-value knowledge that they can use to make key asset decisions. 

There is a wide range in the types of data analytics offered by Sonomatic – below are just some of those methods that allow each data analyst on our team to maximise the value delivered from our clients data. 

Data Trending

Sonomatic have developed a novel approach to data analysis and trending by looking at whole datasets and long-term statistical behaviour to consider how corrosion could be affecting components. This approach allows our team to identify trends and determine behaviour before considering any sub-groupings of data points that are showing similar behaviour. 

The inspection data is first normalised with respect to the nominal thickness, this allows results from different diameters and thicknesses to be reviewed at the same time and any trends identified. This approach also allows spurious readings to be identified. The example below shows that there is a noticeable downward trend in the data which is indicative of corrosion. 

However, it may be the case that this trend has been caused by a subset of the data and Sonomatic’s approach to data trending means that there is the capability to drill further down into the data and investigate all potential groupings to identify which subgroups are showing greater wall loss. 

This approach allows a corrosion rate per grouping to be calculated giving the client added information and value from the inspection data. In this case, our analysis method identified key sub-groups where the corrosion was dominant which led to the client optimising inspection planning. 


Data Comparisons

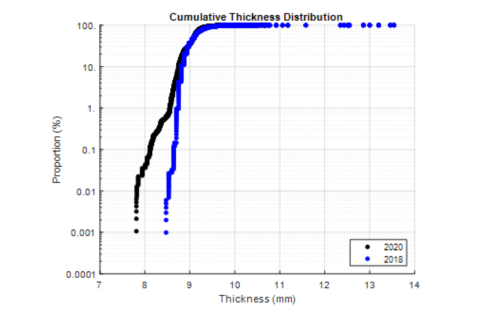
When multiple inspections have been performed, our data analysts can plot cumulative thickness distribution curves simultaneously to give a visual representation of any changes between the multiple inspections. 

The example shown to the left has a change in corrosion behaviour between the two inspections. In 2020, 1% of the inspected area was measured at 8.6 mm or less compared to only 0.03% of the inspected area in 2018. 

Comparing inspections in this manner is particularly helpful when looking to quantify any changes to the extent of corroded areas. Changes to the overall minimum can be easily recorded but comparing the distributions, gives insights into the spatial behaviour of any existing corrosion. 


Data Extrapolation

Sonomatic’s predictive analytics capabilities extend to giving added confidence when an inspection has employed a sampling approach or, for some reason, the inspection did not achieve the required coverage. 

Where a thickness distribution shows abnormal behaviour, a statistical extrapolation can be used to calculate the minimum in uninspected areas. The calculation also generates a probability of the minimum being below any alarm limits defined by the client. 


Data Profiling

Another of Sonomatic’s data analytics techniques allows data profiles to be produced in the form of an axial (cut through) profile, a river bottom profile, or circumferential polar plots. 

Plots of this type give a quick and easy visual representation of any locations of concern as well as being used for comparisons. 

In addition, circumferential polar plots give a clear representation of how thickness variations manifest around the circumference of the pipe. The circumferential polar plot example shows data being compared where there was significant corrosion between inspections. There is no limit to the number of historical inspections that can be compared for this type of analysis. 

Get in touch with us today