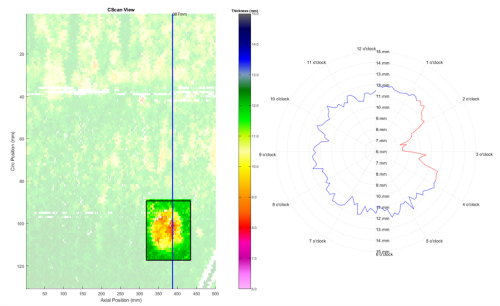
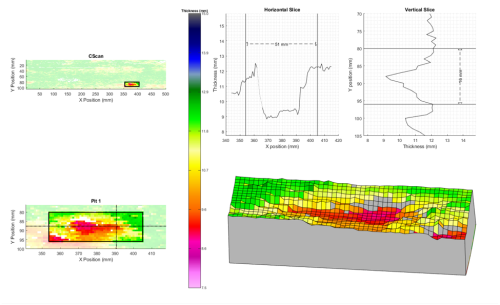
C~View allows you to extract more value from your data with its suite of analysis and visualisation tools. CSVs and off the shelf file formats can be imported to build and view corrosion maps with adjustable colour limits and scales. Up to 4 CScans can be selected at once to review and compare differences between multiple inspections. Analysis tools allow you to delve into your data in greater detail and the range of visualisation options makes sharing results with internal and external stakeholders more accessible and understandable.

If you are interested in a demo or licencing this software please contact us at cview.sims@sonomatic.com.

Importing Data

C~View’s Import Wizard makes it easy to import multiple files at once and create a composite CScan. The user is given the choice to import Max, Min or Mean values for any positions where files overlap. While being imported, data below a chosen value can be excluded to help remove spurious readings.

Positions can be extracted from the dimensions of the data or the filename if they are provided, or adjusted manually to ensure the individual files slot together exactly as intended. Each file can be previewed within the import wizard during the importing process to help ensure the right file goes in the right place.

Comparisons

C~View allows comparisons of up to 4 CScans at once using the Cscan selection. As well as being able to see the differences visually the analysis tools work with multiple selected CScans so you can directly compare distributions, histograms, 2D profiles, 3D models, and pits. These can be used to show the change between two or more inspections or compare the differences between different analysis types.

Data Gridding

Sometimes it is necessary to exclude spurious readings from a dataset. C~View allows you to exclude results below a chosen value and/or plot the data as a grid.

Gridding allows for CScans to be divided up into cells with a specific value reported for each cell. The Grid can be applied to the CScan in customisable step sizes in both the X and Y axes allowing for fine control over the creation.

Each cell can report on:

  • Minimum
  • Maximum
  • Mean
  • Value at a specific percentile

Statistical Analysis

C~View enables you to employ a statistical based approach to data analysis. By looking at the data as a whole in this way, it is often possible to extract more value than can be seen just by looking at a CScan.

The cumulative distribution view shows the percentage of the area which falls below a specific thickness. In the below example on the left, the area highlighted on the lower end of the graph shows that 1% of the data falls below 9.5mm.

The Histogram view on the right allows for plotting the spread of thickness values. Each thickness is coloured to match the CScan.

Looking at the data as a whole in this way allows trends and anomalies to be spotted quickly and tracked over time.

Pit Analysis & 2D Profiling

The pit analysis view can be used to look in depth at a specific area of interest such as a pit. The horizontal and vertical plot shows a 2D slice of data which can be useful for understanding the depth and extent of the area in question.

Tools and options allow you to add labels and measurements to the plots, such as the nominal thickness or river bottom profiles.

Profile view is particularly useful for pipes and plots the 2D profile of the entire circumference in a circular plot to give an understanding of thickness variation around a pipe. Many of the analysis tools can be used with the lasso feature to look closely at a specific area. In this case, the profile view shows the area in the lasso as a different colour on the plot.

3D Views

3D Views help to better understand the data and make it easier to share results with others in a format that is easily and immediately understandable. The 3D Views can be rotated and scaled to make it easy to understand the scale and extent of the data. 3D Views of just a specific area are visible in the pit analysis page with options for changing the way the edges and transparency are plotted.

In the full 3D View page the whole dataset can be plotted on various types of components such as a flat plate, a pipe or a pipe section. The full 3D View allows you to create a cross section and crop data past a certain point to get a closer look at a specific point through the data.

Frequently Asked Questions

CView is a client desktop application which can be licensed to users to enable them to access inspection data and some of the capabilities of SIMS. This allows more detailed analysis and/or understanding of inspection datasets for both technical and non-technical staff.

Get in touch with us today